Fatality Charts
Fatality Statistics for Cars, Trucks, and Pedestrian Accidents
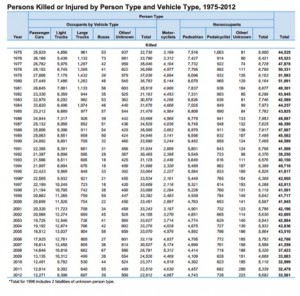
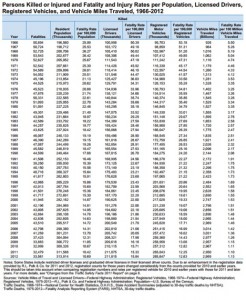
Thecharts below contain comprehensive statistics for fatalities and fatality rates from 1966 through 2012, and for persons killed by vehicle type from 1975 through 2012, respectively. As of 2014, these charts include the latest information available.


Source: //www-nrd.nhtsa.dot.gov/Pubs/812032.pdf
Related Pages
- Car, Truck and Motor Vehicle Accidents
- Automobile Accident FAQ
- Automobile Insurance Coverage
- New York No-Fault Law
- Liability Insurance
- Auto Accident Injury Data
- Fatality Charts
- Passenger Injuries
- Pedestrian Injuries
- Pedestrian Injury Data
- What Should I Do if I’m Injured in an Automobile Accident
- Seat Belt Issues
- Speeding
- Speeding Fatality Charts
- Sate Accident Fatality Charts
- Whiplash
- School Bus Accidents
- Bus Accident Charts
- Motorcycle Accidents
- Motorcycle Accident Statistics
- Tips for Preventing Motorcycle Injuries
- Truck Accidents
- Large Truck Accidents
- Large Truck Data


